Ozzie & Harriet Won't Help America's Severe Unhappiness Index
/Psychology Today reports a common research theme among countries: America has become less happy in the last quarter of a century. The current stress of our nation splitting apart at the seams confirms what studies including the World Values Survey and the General Social Survey of the National Opinion Research Center tell us.
America’s great entrepreneurial spirit has declared that an entire citizenry should live for ‘the pursuit of happiness.’ Business has defined the American dream as entitlement and obvious status, creating an American Nightmare:
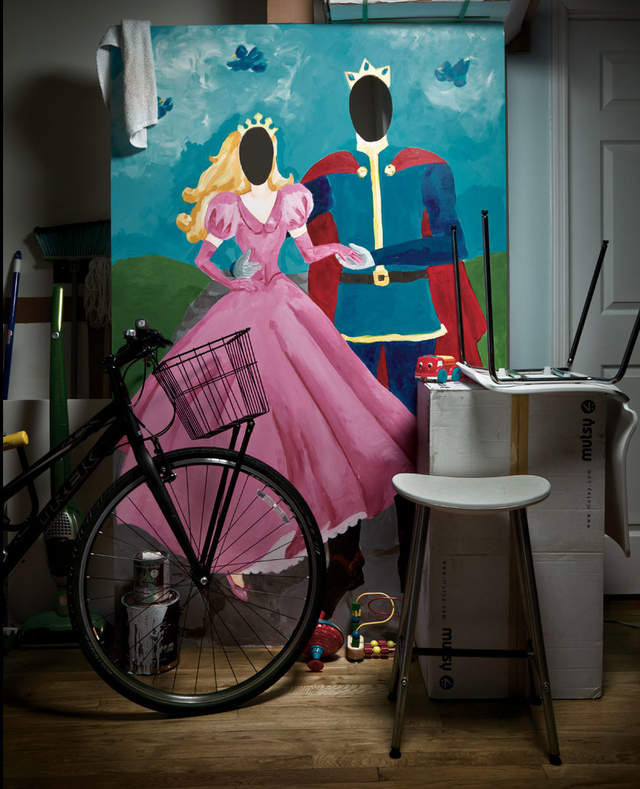
‘Two fat incomes plus a two-car garage plus two master-bathroom sinks plus two-point-something kids equals one happy family. To be sure, the recession has deferred some of the dream. Still, we imagine that in time we’ll realize the formula for a satisfied adulthood once more. We’ll land the job, catch the spouse, buy the house, have the kids. In short, we’ll live the better life,’ writes Lauren Sandler .
The immediate response is that such an argument confirms Sandler as a commie socialist who is out to undermine America. Actually, she’s just confirming well-established facts.
 America’s first reality show: The Nelsons including Ozzie, Harriet, David and Ricky.Conservatives like Phylis Schlafly and Sarah Palin continue to say that America is ‘obviously’ the best at everything, including its women’s rights. Tell that to the women who go to Planned Parenthood. Tell that to the American women whose bodies are becoming political battlefields across America.
Palin and Schlafly say feminism is to blame with everything that’s wrong with America.
Pursuit of ‘Happiness’ Highest in Scandinavia
In fact the Scandinavian countries are much happier than America, having low unemployment rates, growing economies, the absence of America’s class system of rich and poor, and the highest levels of feminism in the world. Remember, the end of America’s middle class is real and getting more pronounced every year.
The top-earning 20 percent of Americans — those making more than $100,000 each year — received 49.4 percent of all income generated in the U.S., compared with the 3.4 percent earned by those below the poverty line, according to newly released census figures. That ratio of 14.5-to-1 was an increase from 13.6 in 2008 and nearly double a low of 7.69 in 1968. via AP
To even print research facts about countries that are happier than America could be grounds for being hauled before the McCarthy-like commissions that will surely be forming next in the Republican war on women. I anticipate that women with articulate voices will be held accountable for undermining the nation.
Hopefully, we’re beyond witch hanging as a country, but the events of Salem, Massachusetts happened only 300 years ago. Listening to Glenn Beck talk about the ‘whores who go to Planned Parenthood’ was chilling and made me afraid for American women, just listening to him mock us.
In 2010 I wrote Status vs Money | A Third Look at Happiness, Gender Equality & Taxes. It studied a range of happiness indicators and folded in tax rates and also gender equality rates. You can listen to Phyllis Schlafly or you can believe multiple, global research studies by people smarter than both of us.
The countries with the greatest gender quality — including woman-friendly family leave policies — and partnership/marital unions that work, are the happiest or most satisfied. Rejecting the ‘happiness’ index as ridiculous — people are not happy all the time — we focus on life satisfaction indexes, then fold in information like tax rates, government services and gender equality. Anne
The results of countries in which citizens are most satisfied are:
1. Denmark
Satisfaction With Present Life: 90.1; Predicted Satisfaction With Future Life: 92.3; 2009 Gross Domestic Product Per Capita: $68,362; Unemployment Rate: 2%; Individual Tax Rate 62.3; Gender Equity 7
2. Finland
Satisfaction With Present Life: 85.9*; Predicted Satisfaction With Future Life: 88.0; 2009 Gross Domestic Product Per Capita: $55,344; Unemployment Rate: 6.4%; Individual Tax Rate 31.5; Gender Equity 2
3. Netherlands
Satisfaction With Present Life: 85.1; Predicted Satisfaction With Future Life: 88.2; 2009 Gross Domestic Product Per Capita: $55,453; Unemployment Rate: 4.5%; Individual Tax Rate 52.0; Gender Equity 11
4. Sweden
Satisfaction With Present Life: 82.7; Predicted Satisfaction With Future Life: 85.6; 2009 Gross Domestic Product Per Capita: $54,908; Unemployment Rate: 6.4%; Individual Tax Rate 56.7; Gender Equity 4
5. Ireland
Satisfaction With Present Life: 81.1; Predicted Satisfaction With Future Life: 91; 2009 Gross Domestic Product Per Capita: $63,788; Unemployment Rate: 6.2%; Individual Tax Rate 41.0; Gender Equity 8
6. Canada
Satisfaction With Present Life: 78.0; Predicted Satisfaction With Future Life: 87.3; 2009 Gross Domestic Product Per Capita: $46,799; Unemployment Rate: 6.1%; Individual Tax Rate 29.0; Gender Equity 25
7. Switzerland
Satisfaction With Present Life: 77.4; Predicted Satisfaction With Future Life: 80.9; 2009 Gross Domestic; Product Per Capita: $65,563; Unemployment Rate: 3%; Individual Tax Rate 40.0; Gender Equity 13
8. New Zealand
Satisfaction With Present Life: 76.7; Predicted Satisfaction With Future Life: 85.5; 2009 Gross Domestic Product Per Capita: $30,556; Unemployment Rate: 4%; Individual Tax Rate 39.0; Gender Equity 5
9. Norway
Satisfaction With Present Life: 76.5; Predicted Satisfaction With Future Life: 84.3; 2009 Gross Domestic Product Per Capita: $98,822; Unemployment Rate: 2.6%; Individual Tax Rate 40.0; Gender Equity 3
10. Belgium
Satisfaction With Present Life: 76.3; Predicted Satisfaction With Future Life: 75.5; 2009 Gross Domestic Product Per Capita: $49,888; Unemployment Rate: 6.5%; Individual Tax Rate; Gender Equity 33


